Where does Nevada rank in fastest-warming states?


Pixabay
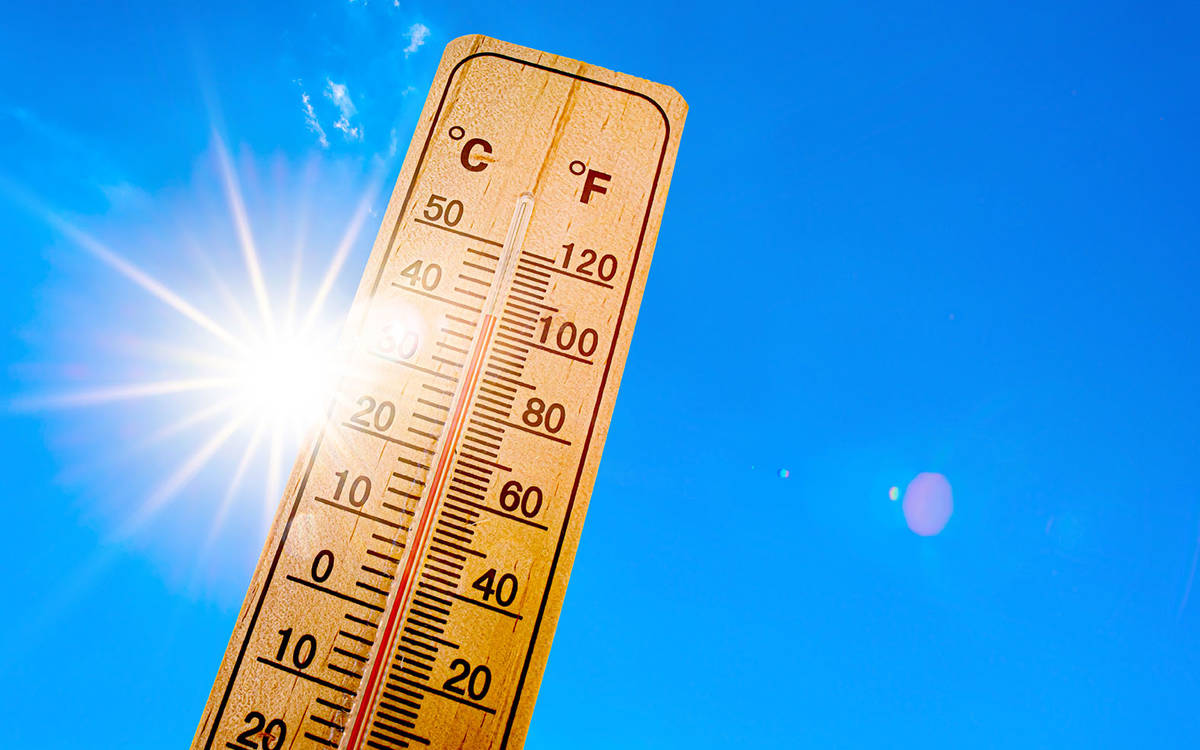
Just a degree or two degrees hotter doesn’t seem like a lot. You would barely notice the change on a sunny afternoon, or in the warmth of a cup of coffee. But over time, it’s enough to change our environment from top to bottom.
Every state is growing warmer, with higher temperatures fueled by everything from powerful ocean currents and giant coal-fired power plants to commuters, cows, and leaky old buildings.
To find out which states have warmed the fastest since 1970, Stacker consulted Climate Central’s 2020 Earth Day report. In this report, we looked at the Applied Climate Information System’s time-series data from major metropolitan areas in each state.
The leading cause of temperature increases today is human-derived greenhouse gases, especially carbon dioxide and methane, which trap heat in our atmosphere. The more gases we emit by burning fossil fuels like oil, gas, and coal, and in our farming practices, the more heat is trapped. Plants and trees mitigate the situation somewhat by absorbing carbon dioxide to produce oxygen. The ocean absorbs carbon dioxide, too, but that process makes it more acidic.
As temperatures rise, winters grow shorter. The ice on the Great Lakes forms later and disappears earlier. Colorado’s snowpack is melting as much as 30 days sooner than it was just a generation ago. With less snow in the New Mexico and Colorado mountains to feed the Rio Grande, the river is drying up.
Meanwhile, springs are wetter, with flooding more common (and more destructive), and summers are drier with longer stifling heat waves that can be debilitating—and deadly—for those who cannot afford the price of staying cool. Wildfires are whipped across mountain forests by overheated winds, and barges run aground in the low waters of the Mississippi River.
Evaporation threatens supplies of water for drinking and irrigation, while algal blooms choke inland lakes. In the heartland, crop yields are declining. Along the coasts, land is getting too salty for farming, as intruding saltwater seeps into freshwater aquifers and groundwater. Dairy and beef cattle stop eating, foliage trees grow dull, and sugar maple trees die.

Spectacular beaches are also disappearing. Rising seas threaten the existence of scenic barrier islands, and ocean levels around the world could rise more than four feet by 2100 if aggressive mitigation efforts aren’t undertaken, according to a study published on May 8, 2020, in npj Climate and Atmospheric Science.
Many states are taking actions to burn less coal, use less electricity, tighten fuel standards, encourage people to drive less, create greener cities, and construct more efficient buildings to change our consumption, our behaviors, our habits, and our attitudes about warming temperatures. Keep reading to see which states have experienced the fastest temperature increases in the last 50 years, and how those increases have affected the people calling those states home.
You may also like: Major cities most at risk of rising sea levels
")
CrackerClips Stock Media // Shutterstock
#50. Maryland (tie)
- Temperature change 1970–2019: 1.37° F
- Fastest-warming metro areas:
—- Baltimore: 1.3° F
—- Hagerstown: 1.3° F
—- Salisbury: 1.5° F
Sea levels are climbing faster in Maryland than elsewhere because the state’s coastal area itself is sinking. With the sea-level rise comes beach erosion, submerged tidal wetlands, and the intrusion of saltwater into freshwater aquifers, rendering soil too salty for crops and trees.
")
Pixabay
#50. Mississippi (tie)
- Temperature change 1970–2019: 1.37° F
- Fastest-warming metro areas:
—- Hattiesburg: 1.4° F
—- Jackson: 1.6° F
—- Tupelo: 2.6° F
Mississippi soil has grown drier, exacerbating more heavy downpours throughout the state that damage crop yields and livestock. More extreme weather, earlier winter snowmelt to the north, and more powerful rains mean flooding along the Mississippi River is more frequent and more destructive.
")
Pixabay
#50. South Dakota (tie)
- Temperature change 1970–2019: 1.37° F
- Fastest-warming metro areas:
—- Rapid City: 0.6° F
—- Sioux Falls: 1.7° F
—- Mitchell: 1.8° F
South Dakota will suffer a 75% increase in the severity of its summer droughts by 2050. The state now averages 10 dangerous heat days per year; that number is projected to hit 35 days by 2050.

Pixabay
#47. Hawaii
- Temperature change 1970–2019: 1.40° F
- Fastest-warming metro area:
—- Honolulu: 1.4° F
Carbon dioxide emissions in Hawaii, so heavily reliant on tourism, stem largely from its transportation use, both vehicles and airplanes. Rising sea levels imperil Hawaii’s beaches, roads, and coastal communities. Rainfall, meanwhile, has been decreasing, threatening freshwater sources in the mountains that are home to vulnerable species and ecosystems, and increased drought threatens production of taro and breadfruit, traditional food sources.

Pixabay
#46. Idaho
- Temperature change 1970–2019: 1.50° F
- Fastest-warming metro areas:
—- Lewiston: 1.7° F
—- Twin Falls: 1.7° F
—- Boise: 3.7° F
Idaho’s arid climate means it tends to warm more easily than other, wetter climates. The temperature rise in Boise is more than twice the national average, attributed in part to the city’s car and truck usage. City officials have found the average Boise resident makes 10 trips a day.
You may also like: Fastest-warming cities in the U.S.
")
Pixabay
#45. Indiana (tie)
- Temperature change 1970-2019: 1.52° F
- Fastest warming metro areas:
—- Fort Wayne: 1.8° F
—- Evansville: 2° F
—- Indianapolis: 2.4° F
Rising temperatures in Indiana are affecting crop production. In 2019, its second-wettest year in history, corn and soybean crop yields dropped significantly, according to the U.S. Department of Agriculture. The corn revenue loss to Indiana farmers alone was estimated at roughly $469 million. Unless Indiana cuts emissions, it is projected that the average number of days in Indiana with a heat index above 100 degrees Fahrenheit will increase from four to 43 days a year by midcentury.
")
Pixabay
#45. Iowa (tie)
- Temperature change 1970–2019: 1.52° F
- Fastest-warming metro areas:
—- Dubuque: 1.5° F
—- Des Moines: 2.5° F
—- Waterloo: 2.5° F
Warming over the Gulf of Mexico pushes more frequent heavy storms to the Midwest, causing destructive flooding in states like Iowa. Development in Des Moines has made flooding worse, due to runoff and an outdated storm sewer system. Flooding endangers farming, from corn to hogs, that makes up a quarter of the state economy. Annual precipitation in Iowa has been increasing since the 1970s at 1.25 inches per decade, the largest increase in the country.

Pixabay
#43. Colorado
- Temperature change 1970–2019: 1.53° F
- Fastest-warming metro areas:
—- Grand Junction Area: 0.7° F
—- Denver: 1.3° F
—- Colorado Springs: 2.6° F
Nearly all of Colorado’s greenhouse gas emissions come from fossil fuels burned for electricity, transportation, and residential, commercial, and industrial heating applications. The warming temperatures cause water scarcity, drought, and pine beetle infestation, and the snowpack is reduced, melting as much as 30 days sooner than it was 25 years ago. Colorado relies on snowpack for 70% of its water supply.

Pixabay
#42. California
- Temperature change 1970–2019: 1.56° F
- Fastest-warming metro areas:
—- San Francisco: 2.6° F
—- Santa Maria: 2.8° F
—- Fresno: 3.6° F
The use of fossil fuels in California has contributed significantly to rising temperatures. Impacts from these increases include searing heat waves and dry summers that contribute to deadlier wildfires. Fires, in turn, create more warming, emitting carbon dioxide and ash while also destroying forests, homes, and wildlife.

Sherry V Smith // Shutterstock
#41. Virginia
- Temperature change 1970–2019: 1.58° F
- Fastest-warming metro areas:
—- Norfolk: 2.3° F
—- Richmond: 2.3° F
—- Roanoke: 3° F
Nearly two-thirds of Virginia’s electricity is generated by the burning of fossil fuels. Two proposed projects—the Atlantic Coast Pipeline and the Mountain Valley Pipeline—would cross the state carrying natural gas from West Virginia, and have prompted concern they will strengthen Virginia’s links to natural gas. The state has experienced increasingly frequent and destructive storms and flooding.
You may also like: Natural disasters linked to climate change

Travellagio // Shutterstock
#40. Massachusetts
- Temperature change 1970–2019: 1.60° F
- Fastest-warming metro areas:
—- Boston: 1.3° F
—- Springfield: 1.9° F
Carbon emissions from cars and trucks are one of the biggest sources of greenhouse gases in Massachusetts, due in part to extensive commuting in the Boston metro area and traffic congestion. With precipitation from heavy storms up 70% from the mid-20th century across the Northeast, flooding has become a threat to coastal communities and tidal wetlands where bass and clams are harvested. Warmer ocean waters mean the cod and lobster industry also will suffer.
")
Dex Sightseeing Photography // Shutterstock
#39. Delaware (tie)
- Temperature change 1970–2019: 1.70° F
- Fastest-warming metro area:
—- Wilmington: 1.7° F
Rising temperatures in Delaware mean the state, which has an average of 10 dangerous heat days a year, will have five times as many by 2050, projections show. Around 20,000 state residents today are considered to be particularly vulnerable to extreme heat. Delaware further has a greater proportion of its land at risk of coastal flooding than any other continental state, except for Florida and Louisiana.
")
Pixabay
#39. Wyoming (tie)
- Temperature change 1970–2019: 1.70° F
- Fastest-warming metro areas:
—- Casper: 1.2° F
—- Cheyenne: 2.2° F
Wyoming is sparsely populated and largely open range, and most of its land is used for livestock grazing. Cattle produce methane, a greenhouse gas 25 times stronger than carbon dioxide in trapping heat. One cow can emit anywhere from 66 to 132 gallons of methane daily. Warmer temperatures have contributed to a jump in the numbers of potentially toxic algae blooms. Droughts in Wyoming can be severe: With the state situated at the top of key watersheds, there aren’t alternative sources of water coming into the state.
")
Eduardo Medrano // Shutterstock
#37. Arkansas (tie)
- Temperature change 1970–2019: 1.90° F
- Fastest-warming metro areas:
—- Jonesboro: 0.9° F
—- Little Rock: 2° F
—- Ft. Smith: 3.8° F
Almost 40% of Arkansas’ in-state electric supply comes from coal, and the state’s rice production—the largest in the U.S.—utilizes natural gas for drying the rice each fall. The Arkansas Fish and Game Commission has warned that Arkansas can expect more heat waves, heat-related illness, intense rainfall, erosion, drought, and flooding.
")
Pixabay
#37. Connecticut (tie)
- Temperature change 1970–2019: 1.90° F
- Fastest-warming metro area:
—- Hartford: 1.9° F
A major source of temperature increases in Connecticut is the warming ocean. Research has found those higher temperatures spread inland via connected waterways. As sea levels rise, Connecticut’s coastal wetlands, beaches, and shoreline development are also threatened. Inland, warmer temperatures disrupt the state’s $70 million dairy industry, causing cows to eat less and produce less milk.
You may also like: Average temperature change in every state over the past 100 years

Pixabay
#35. Montana
- Temperature change 1970–2019: 1.96° F
- Fastest-warming metro areas:
—- Glendive: 2.1° F
—- Billings: 2.3° F
—- Helena: 3.6° F
Evidence of warming temperatures in Montana, which uses coal and also a significant amount of hydropower to produce its electricity, can be found in the northern mountains of Glacier National Park. The park had more than 100 glaciers when it was established in 1910. Now, there are about two dozen glaciers left, due to higher summer temperatures and shrinking winter snowpack. The Park Service says warmer, drier conditions have contributed to frequent, severe wildfires in western states since the early 1980s, and are expected to continue.
")
cla78 // Shutterstock
#34. New York (tie)
- Temperature change 1970–2019: 1.98° F
- Fastest-warming metro areas:
—- Syracuse: 2.1° F
—- Utica: 2.1° F
—- Albany: 3.5° F
About a third of New York’s electricity comes from nuclear power plants, considered zero emitters. In 2018, the state produced the most hydroelectric power east of the Rocky Mountains. With almost one in three residents using public transportation to get to work (pre-pandemic), New York consumes less petroleum per capita than any other. But warming temperatures—particularly upstate in cities like Albany—threaten destructive storms and inland flooding.
")
Pixabay
#34. South Carolina (tie)
- Temperature change 1970–2019: 1.98° F
- Fastest-warming metro areas:
—- Charleston: 2.3° F
—- Columbia: 2.8° F
—- Upstate: 3° F
The use of natural gas to produce electricity in South Carolina increased almost fourfold from 2008 to 2018, as power producers shied away from coal for that purpose. Critics, including the state’s wildlife association and a special task force addressing climate change, say the state needs to confront rising temperatures and sprawling coastal development or risk flooding, saltwater intrusion, beach erosion, crop loss, and hotter summers that would be dangerous to residents who cannot afford air conditioning or are forced to work outside.

Pixabay
#32. Florida
- Temperature change 1970–2019: 1.99° F
- Fastest-warming metro areas:
—- Tampa: 2.9° F
—- Tallahassee: 3° F
—- Panama City: 3.2° F
The three hot spots for temperature rise in Florida—Tampa, Tallahassee, and Panama City—sit close to the Gulf of Mexico, which has been warming for decades. Data from NOAA showed the Gulf’s temperature was at a historic high ahead of Hurricane Harvey in 2017, and the combined heat and moisture contributed to the storm’s devastating power. Global warming threatens the state with more frequent and destructive hurricanes.

f11photo // Shutterstock
#31. Missouri
- Temperature change 1970–2019: 2.01° F
- Fastest-warming metro areas:
—- Springfield: 2° F
—- Columbia: 2.7° F
—- St. Louis: 3.7° F
Missouri cut its carbon emissions by about a sixth from 2005 to 2016, according to the U.S. Energy Information Administration, largely by closing some of its coal-burning power plants. Still, roughly three-quarters of Missouri’s electricity generation comes from coal; next to Texas, Missouri uses more coal for power generation than any other state. Warmer temperatures in Missouri mean more frequent flooding along the Mississippi and Missouri rivers, as well as more summer droughts.
You may also like: States with the most hailstorms
")
Pixabay
#30. Alabama (tie)
- Temperature change 1970–2019: 2.02° F
- Fastest-warming metro areas:
—- Tuscaloosa: 2.3° F
—- Birmingham: 3.2° F
—- Huntsville: 3.5° F
Warming nights, along with warming winters, threaten Alabama’s coast and forests with pests and invasive species. Insects that would have died off in the cool of winter no longer do so, and species moving in with the warmer temperatures are pushing others out. Warming temperatures cause evaporation which, along with population growth and irrigation needs, could cut the state’s water supply by 5% over the next 40 years.
")
ESB Professional // Shutterstock
#30. Georgia (tie)
- Temperature change 1970–2019: 2.02° F
- Fastest-warming metro areas:
—- Columbus: 2.2° F
—- Augusta: 2.4° F
—- Atlanta: 3.3° F
Forty-one percent of Georgia’s electricity in 2018 came from natural gas, with 25% produced in coal-fired plants. Eight percent of its energy is renewable. Projections indicate the state, which now has an average of 20 dangerous heat days every year, could see that number rise to more than 90 days a year by 2050. Extreme heat in the state threatens around 310,000 people considered particularly vulnerable.

Pixabay
#28. Nebraska
- Temperature change 1970–2019: 2.03° F
- Fastest-warming metro areas:
—- Lincoln: 1.6° F
—- Omaha: 2.2° F
—- North Platte: 2.3° F
Nebraska’s in-state energy use is the third-highest in the U.S. due to the power needs of agriculture practices, irrigation systems, and food processing. Warming temperatures in the state have brought heavy rains and subsequent erosion and higher humidity levels that stress livestock.

Pixabay
#27. Oklahoma
- Temperature change 1970–2019: 2.05° F
- Fastest-warming metro areas:
—- Tulsa: 1.9° F
—- Oklahoma City: 2.2° F
Oklahoma generates a third of its electricity from the wind, the most among U.S. states except for Texas. Despite harnessing so much renewable energy, transportation and development throughout the Oklahoma City area have contributed to warming temperatures in the state. Drier soils will increase demand for irrigation on farms—but most irrigation water in the state’s Panhandle comes from an aquifer that in parts has shrunk more than 25% since the ‘50s.

Pixabay
#26. Oregon
- Temperature change 1970–2019: 2.08° F
- Fastest-warming metro areas:
—- Portland: 1.8° F
—- Bend: 2.1° F
—- Medford: 3.4° F
Higher temperatures in Oregon and elsewhere in the Pacific Northwest are linked to more droughts, less snow in the mountains (big sources of fresh water), and a longer and more destructive wildfire season. Oregon Gov. Kate Brown took aim in March 2020 at the state’s sources of greenhouse gas emissions, setting industry caps and strengthening a clean fuels program to reduce carbon intensity in gasoline and diesel.
You may also like: Places with the most weather-related fatalities

Pixabay
#25. Illinois
- Temperature change 1970–2019: 2.10° F
- Fastest-warming metro areas:
—- Moline: 2.3° F
—- Rockford: 2.5° F
—- Peoria: 3.3° F
Cars and trucks have become the largest source of carbon dioxide emissions in Illinois, according to U.S. government data. The rise in vehicle emissions has been fueled by commuters, delivery services, and ride-hailing companies. Illinois is the fifth-largest energy consumer in the country, due in large part to its petroleum refining and coal mining.

Pixabay
#24. Michigan
- Temperature change 1970–2019: 2.11° F
- Fastest-warming metro areas:
—- Traverse City: 2.8° F
—- Grand Rapids: 2.9° F
—- Detroit: 3.4° F
Every Great Lake has warmed 1.5 degrees Fahrenheit or more since 1995; and proximity to Lakes Michigan, Huron, Superior, and Erie contributes to rising temperatures throughout Michigan. Roughly a 10th of the state’s electricity generation is renewable. A major impact of warmer temperatures is algal blooms in Michigan’s lakes, threatening drinking water supplies and creating flooding that causes pollution-spewing overflows in sewer systems.
")
Patricia Hofmeester // Shutterstock
#23. New Hampshire (tie)
- Temperature change 1970–2019: 2.15° F
- Fastest-warming metro areas:
—- Manchester: 1.2° F
—- Concord: 3.1° F
Since 1970, winter temperatures in New Hampshire and surrounding New England States have risen more than in the rest of the country. In Concord alone, the winters have warmed nearly twice the national average. Impacts of climate change could hit New Hampshire’s industries, especially tourism, hard, with fewer ski season days, damage to sugar maples, flooding of coastal towns, a loss of cold water trout fishing, and dulled fall foliage due to unhealthy and dying trees.
")
Pixabay
#23. Ohio (tie)
- Temperature change 1970–2019: 2.15° F
- Fastest-warming metro areas:
—- Cleveland: 3.1° F
—- Toledo: 3.3° F
—- Columbus: 3.4° F
Ohio is a big user of coal, coming in third after Texas and Indiana among U.S. states, and almost all of that coal is used to generate electricity. The last decade has been the state’s wettest ever, and warming brings the threat of more frequent and dangerous flooding.
")
ESB Professional // Shutterstock
#23. Tennessee (tie)
- Temperature change 1970–2019: 2.15° F
- Fastest-warming metro areas:
—- Memphis: 2° F
—- Nashville: 2.4° F
—- Chattanooga: 4.3° F
Tennessee has gradually moved away from coal for electricity, which is produced by area energy giant Tennessee Valley Authority (TVA). Three coal-fired plants have closed since 2012, and two more are slated to close in the next three years, leaving four in operation.
You may also like: States with the most severe summer weather
")
Pixabay
#20. Washington (tie)
- Temperature change 1970–2019: 2.17° F
- Fastest-warming metro areas:
—- Seattle-Tacoma: 2° F
—- Yakima: 2.2° F
—- Spokane: 2.3° F
Washington produces more electricity from hydroelectric power than any other state, thanks to the Grand Coulee Dam on the Columbia River, which is the largest-capacity hydroelectric power plant in the country. But the state’s greenhouse emissions have been on the rise, due mostly to its booming economy and population growth; transportation; and the heating of residential and commercial buildings.
")
Pixabay
#20. West Virginia (tie)
- Temperature change 1970–2019: 2.17° F
- Fastest-warming metro areas:
—- Charleston: 2° F
—- Bluefield: 2.9° F
—- Wheeling: 3.7° F
West Virginia lies in the heart of the Appalachian Mountains, where higher temperatures put the region’s critical forest cover at risk. Increasingly heavy rainfall and powerful storms cause flooding in West Virginian winters and springs, while higher temperatures threaten drought in the summer and fall.
")
Pixabay
#18. New Jersey (tie)
- Temperature change 1970–2019: 2.40° F
- Fastest-warming metro areas:
—- Newark: 1.6° F
—- Atlantic City: 3.2° F
Warming in New Jersey is linked to its location on the Atlantic coast, where higher water temperatures have an impact on air temperatures. The eastern coast’s ocean temperature’s rise in the last three decades has forced aquatic life like American shad and lobster to move north. Inland lakes have been stricken with toxic algae blooms; two beaches at popular vacation spot Lake Hopatcong were closed to swimming in the summer of 2019.
")
Pixabay
#18. North Dakota (tie)
- Temperature change 1970–2019: 2.40° F
- Fastest-warming metro areas:
—- Minot: 1.9° F
—- Bismarck: 2.6° F
—- Fargo: 2.7° F
Nearly two-thirds of North Dakota’s electricity is produced by coal-burning power plants, although wind energy accounts for another quarter of production. Its warming temperatures increase precipitation, the severity of storms, and the risk of flooding. Floods have worsened considerably in the watershed of the Red River in the eastern part of the state.
")
Albert Pego // Shutterstock
#18. Rhode Island (tie)
- Temperature change 1970–2019: 2.40° F
- Fastest-warming metro area:
—- Providence: 2.4° F
Transportation use, including not only cars and trucks but airplanes and boats, accounts for more than a third of Rhode Island’s greenhouse gas emissions, followed by electricity consumption and residential heating. In addition, the state is warmed by its 420 miles of coastline along the warming Gulf Stream that brings water up the East Coast.
You may also like: Dramatic satellite observations that show the true scale of Arctic change

Jon Bilous // Shutterstock
#15. Louisiana
- Temperature change 1970–2019: 2.43° F
- Fastest-warming metro areas:
—- Lake Charles: 2.5° F
—- Shreveport: 2.9° F
—- New Orleans: 3.5° F
Louisiana’s oil refiners and natural gas producers are heavy users of energy, contributing about half of the state’s greenhouse gas emissions. Warming temperatures also are tied to its Mississippi River delta and its coast along the Gulf of Mexico, where the water temperature has been rising for years.

Pixabay
#14. North Carolina
- Temperature change 1970–2019: 2.45° F
- Fastest-warming metro areas:
—- Greenville: 2.9° F
—- Piedmont Triad: 3.2° F
—- Raleigh Durham: 3.3° F
About a third of North Carolina’s greenhouse gas emissions come from electricity generation and another third from transportation use. The state’s greenhouse emissions are fueled by its growing economy, especially the high tech, biotech, and finance industries boosting population growth in the Piedmont Triad, Raleigh Durham, and Greenville. The U.S. Geological Survey estimates the scenic Outer Banks barrier islands will be splintered or eroded away if sea level rises 2 feet by 2100.

Pixabay
#13. Kentucky
- Temperature change 1970–2019: 2.46° F
- Fastest-warming metro areas:
—- Lexington: 2.2° F
—- Bowling Green: 3° F
—- Louisville: 3.2° F
A major source of greenhouse gas emissions in Kentucky is the high amount of coal the state uses to generate electricity. That has produced low electricity rates, which in turn have drawn industries with high energy usage to the state. Other gas-producing activities include coal mining; the manufacture of iron, steel, cement and lime; natural gas production; agricultural burning; and manure management. Over the last decades, Kentucky has seen higher average overnight low temperatures, extreme rains, and flooding.

Pixabay
#12. Maine
- Temperature change 1970–2019: 2.47° F
- Fastest-warming metro areas:
—- Bangor: 1.4° F
—- Portland: 2.7° F
—- Presque Isle: 3.3° F
The Gulf of Maine, along the state’s nearly 3,500-mile coastline, has been warming seven times as fast as the global ocean average. It is where cold Arctic water meets warm water from the Gulf Stream, and the higher temperatures are linked to wider ocean warming and to ice melting in the Arctic Ocean. The higher temperatures threaten the state’s key pulp and paper industry, by making spruce and fir forests vulnerable to invasive species and pest infestations.

Pixabay
#11. Pennsylvania
- Temperature change 1970–2019: 2.53° F
- Fastest-warming metro areas:
—- Wilkes Barre: 2.7° F
—- Philadelphia: 3.1° F
—- Erie: 4° F
Pennsylvania’s greenhouse gas emissions come from its industry, power plants, natural gas drilling, and traffic. Being warmer has meant more precipitation and powerful storms that have taken a toll on infrastructure and crops. The warm temperatures bring higher populations of ticks that carry Lyme disease; Pennsylvania has the highest number of Lyme cases in the nation.
You may also like: Fastest-warming states in the U.S.

Pixabay
#10. Texas
- Temperature change 1970–2019: 2.75° F
- Fastest-warming metro areas:
—- Odessa: 3.6° F
—- McAllen: 4° F
—- El Paso: 4.8° F
Two Texas cities with the highest temperature increase—El Paso and McAllen—sit along the Rio Grande, which has been badly stressed by warming-induced evaporation and less snowmelt. The snowpack in the mountains of northern New Mexico and southern Colorado that feeds the river declined about 25% since the late 1950s. As the 1,900-mile-long river dries up, its cooling effects wane and there is less water for drinking and for irrigation.

Pixabay
#9. Wisconsin
- Temperature change 1970–2019: 2.76° F
- Fastest-warming metro areas:
—- Madison: 2.8° F
—- La Crosse: 3° F
—- Milwaukee: 3.5° F
Warming temperatures in Wisconsin have brought more frequent heavy rainstorms and flooding, and ice on the Great Lakes is forming later and melting earlier. The amount of rain falling on the four wettest days of the year has increased by 35% in the past 50 years.

Pixabay
#8. Alaska
- Temperature change 1970–2019: 2.97° F
- Fastest-warming metro areas:
—- Fairbanks: 2.3° F
—- Juneau: 2.8° F
—- Anchorage: 3.8° F
Key factors contributing to higher temperatures in Alaska are global ocean warming and a loss of sea ice in the Arctic, which is heating up twice as quickly as the rest of the planet. While ice and snow reflect much of the sun’s heat, when they melt, they expose the darker water that absorbs the heat instead. The impact of warming ranges from the high cost of replacing Alaska’s ice roads with gravel to threatening its $5 billion a year commercial fishing industry, that comprises more than 60% of the nation’s commercial fishing business.

Pixabay
#7. Kansas
- Temperature change 1970–2019: 3.05° F
- Fastest-warming metro areas:
—- Wichita: 3° F
—- Topeka: 3.1° F
In Kansas, soil is drier, rain is less predictable and more intense, and flooding is more frequent and severe due to higher temperatures. The added precipitation raises the level of moisture in the soil, which does not drain and makes flooding more damaging. About one-fifth of Kansas’ farmland is irrigated, but warming is projected to dry up rivers and streams and deplete the supply of available water.

Pixabay
#6. Utah
- Temperature change 1970–2019: 3.10° F
- Fastest-warming metro area:
—- Salt Lake City: 3.1° F
Most of Utah’s residents live in mountain valleys susceptible to blankets of warm air trapping smog and polluted air below. Rising temperatures make inversions like this more common. In 2018, some two-thirds of the state’s net electricity generation was produced by coal-fired plants. The water supply from snowpack declines as melting occurs earlier in the year, leaving less water to fill reservoirs. Eighty percent of the water use in the state goes toward ranches and farm irrigation.
You may also like: U.S. cities with the cleanest air

Pixabay
#5. Minnesota
- Temperature change 1970–2019: 3.23° F
- Fastest-warming metro areas:
—- Mankato: 2.8° F
—- Minneapolis St. Paul: 3.4° F
—- Duluth: 3.5° F
Minnesota’s cold climate makes the state vulnerable to rising temperatures, as greenhouse gases trapping heat in the atmosphere act like a layer of insulation to keep the earth from cooling down. The state’s winters have warmed 13 times faster than its summers. More freeze-thaw cycles, wetter winters, and drier summers are affecting vegetation, wildlife, agriculture, and the recreation industry.

Pixabay
#4. Arizona
- Temperature change 1970–2019: 3.28° F
- Fastest-warming metro areas:
—- Yuma: 3.2° F
—- Phoenix: 4.1° F
—- Tucson: 4.3° F
Driven by the growth of Arizona’s economy and population, the state’s greenhouse gas emissions rose more than twice the national rate from 1990 to 2000. Phoenix and Tucson are two of the nation’s fastest-warming cities; the change is most noticeable at night when the respective cities’ temperatures have risen an average of 8 degrees. Each is considered an urban heat island, where structures and surfaces retain heat.

Pixabay
#3. New Mexico
- Temperature change 1970–2019: 3.60° F
- Fastest-warming metro areas:
—- Albuquerque Santa Fe: 3.3° F
—- Las Cruces: 3.9° F
New Mexico residents produce 31 tons of greenhouse gas emissions a year per capita, compared with a national average of 18 tons, a state task force said last year. Its solid and gas industries contributed a quarter of those emissions, followed by transportation use. Roughly a third of New Mexico’s gas emissions are methane, largely from the oil and gas industries. Less snowpack and more evaporation dry up soils and water supplies, taking a toll on the Navajo reservation where a third of the population hauls in water.

Pixabay
#2. Vermont
- Temperature change 1970–2019: 3.90° F
- Fastest-warming metro area:
—- Burlington: 3.9° F
Vermont has the highest level of greenhouse gas emissions per capita in the Northeast. Transportation use accounts for about half those emissions. More than half of households are heated with petroleum, nearly one in seven burn wood for their heat, and many of Vermont’s old, inefficient residential and commercial buildings leak heat. In 2011, more than 2,400 roads, 800 buildings, and 300 bridges—including many historic covered bridges—were damaged or destroyed by Hurricane Irene.

Pixabay
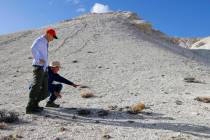
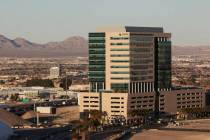
#1. Nevada
- Temperature change 1970–2019: 6.45° F
- Fastest-warming metro areas:
—- Las Vegas: 5.5° F
—- Reno: 7.4° F
Nevada ranks among the top U.S. states utilizing the most geothermal and solar energy to produce electrical power, while simultaneously phasing out coal-fired plants. But contributing to the state’s rising temperatures are transportation use and urban development. Nevada gets the least annual average rainfall of any state and is undergoing lengthier heat waves, earlier mountain snowmelt, and more evaporation, adversely affecting rivers, lakes, and reservoirs. Las Vegas is one of the nation’s most intense urban heat islands, where buildings and pavement retain heat, and sprawling development has more people driving longer commutes.
You may also like: 30 of the most devastating hailstorms in U.S. history
Tsis story originally appeared on Stacker.com.