Pinpointing most dangerous intersection not easy

The corner of Tropicana Avenue and Koval Lane is the most dangerous intersection in the Las Vegas Valley.
So is Lamb Boulevard at Alexander Road.
Then again, maybe it’s Flamingo Road at Koval.
Wait a minute, you say. How can there be more than one most dangerous intersection?
Because it’s simply not that simple.
"Depending on how you look at it, you’ll get a different answer," said Kelly Anrig, safety engineering chief for the Nevada Department of Transportation. "You’ll get whole different answers on where people are injured, where the most crashes are, or crash rate."
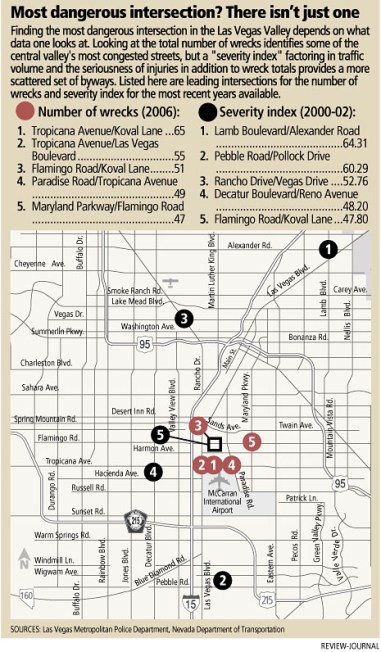
Based on the number of wrecks that took place last year, Tropicana and Koval is the valley’s undisputed champion of fender-benders. No corner had more wrecks in 2006 than the 65 crashes that took place at that crossing, according to Las Vegas police.
If you instead look at a "severity index" that takes into consideration injuries, deaths, traffic volumes and averages of all of the above over an extended period of time — in this case, 2000 to 2002, the latest years for which comprehensive data was available and analyzed — then Lamb and Alexander jumps to the top of the list.
At that corner, there were 40 wrecks that left 50 people hurt in that time span, giving it an index score of 64.31, the Transportation Department noted in a federally mandated "five percent" study looking at the highest-risk intersections. (The index score itself is not indicative of anything, other than the number in relation to other numbers. Higher numbers are more wreck-prone.)
While Trop and Koval is the king of dings, it’s also one of the busiest intersections in town. Indeed, Trop near Koval carried almost 90,000 cars each day in 2005, according to state data. So while there may be more wrecks than elsewhere, there’s also many more cars passing through, meaning it’s less likely that any one driver will get their car dinged there.
But, because of the high number of wrecks and traffic volume, it’s more likely that people will run into and be inconvenienced by a wreck in their path. In that sense, it makes the number relevant, if not conclusive.
Not surprisingly, the intersections with the highest number of wrecks are clustered in the central valley, where traffic is most dense.
At Lamb and Alexander, there are far fewer cars passing through than at Trop and Koval. In 2005, Lamb near Alexander carried just one-seventh the number of cars as Trop near Koval.
However, the "severity index" shows that although there are fewer cars driving by, they are much more likely to get into a wreck than cars cruising through Trop and Koval. And collisions at Lamb and Alexander are more likely to seriously injure drivers and their passengers.
If Lamb at Alexander kept the same index score but gained Trop’s traffic volume, it would have more than 90 wrecks a year, topping Trop’s wreck tally by about 50 percent.
So, while it may not have the number of wrecks as Trop, Lamb might be seen as more "dangerous" by some, since wrecks and injuries are more likely for passers-by.
Like Lamb and Alexander, many of the streets with the worst index scores are lesser-used byways widely scattered throughout the valley.
Except for one crossing. Flamingo and Koval, one of the valley’s busiest intersections, was the only junction to rank among the five worst intersections in both number of wrecks (51 crashes, third-worst overall) and the index score (47.80 score, 177 wrecks, 95 hurt, fifth-worst overall).
Which ranking is most important depends on who’s reading the ranking and what they consider important.
Engineers focus on crash rates more than number of wrecks because that’s what they feel they can best influence through their work.
"The more congested intersections usually go to the top" of crash volume lists, Anrig said, "because there’s more cars there. We’re looking at places where we can do things, make safety improvements that can make a difference."
Indeed, a review of Lamb and Alexander pointed to the need for new stoplights there, which anecdotally appear to have lessened the frequency and severity of accidents, according to the Transportation Department.
"We’re looking at differences that are contributing to (drivers) making mistakes out there," Anrig said.
Traditionally, local police have concentrated their efforts at the highest-volume crash intersections, hoping that such enforcement will be visible to a larger segment of drivers and do a greater job of deterring risky driving behavior, thereby pre-empting jam-inducing wrecks at the most critical crossings.
Bringing together those divergent views offers a clearer picture of traffic trouble spots than any one ranking.
"That’s why when we do our reviews, we try to get law enforcement (involved). They have a different perspective," Anrig said. "It’s real important."
To that end, there is a Nevada Executive Committee on Traffic Safety, which is made up of representatives from police, emergency response, traffic, engineering, safety and education agencies to discuss traffic safety improvements.
That committee also crafted the state’s traffic safety plan, unveiled earlier this year, which takes a similar, wide-ranging approach to stemming traffic deaths in the Silver State. It suggests a mix of targeted police enforcement, the re-engineering of some roads, improved driver education campaigns, upgraded emergency responses to wrecks and changes in analyzing data of where and why wrecks happen.
State highway officials hope the work will eventually prevent one of every four driving deaths in Nevada.
"You can’t just look at it from an engineering standpoint," Anrig said.
If you have a question, tip or tirade, call the Road Warrior at 387-2904, or e-mail him at roadwarrior@reviewjournal.com or OSofradzija@reviewjournal.com. Please include your phone number.