By the numbers: How the homeless population has changed in Southern Nevada

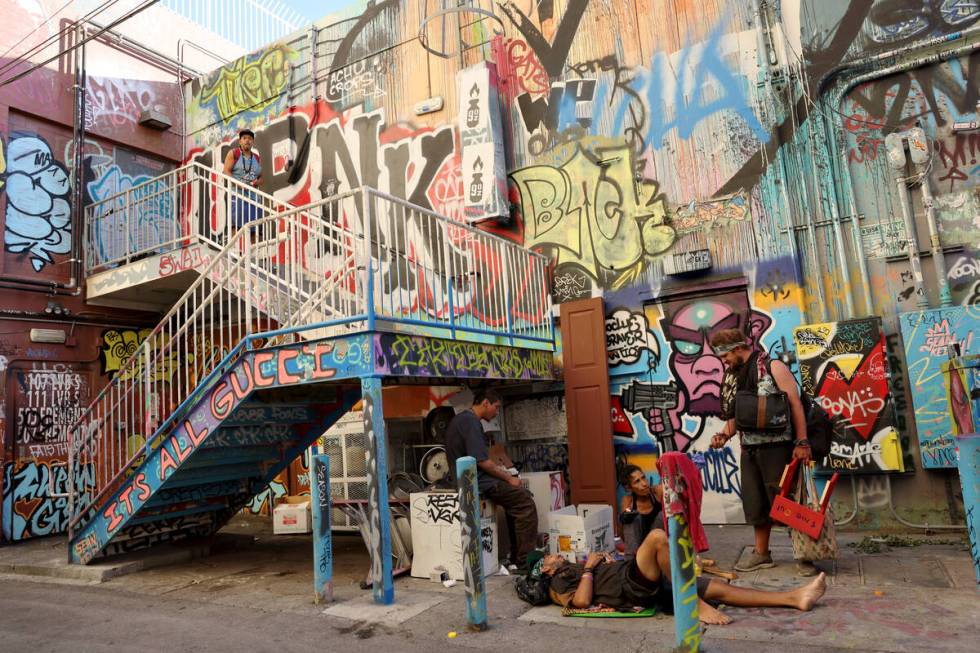
On a brisk January morning, volunteers took to the streets in Southern Nevada to count the valley’s homeless population.
The final tally — including sheltered and unsheltered people — was the highest since 2015, according to the Southern Nevada Homelessness Continuum of Care.
The daylong census figures are not only a requirement for federal grants for municipalities, but also a way to gauge the local government’s priorities in terms of funding programs.
Point in time count by year
While this year’s homeless count increased by 16 percent from last year, officials said that the population in 2020 might have been undercounted because of the pandemic.
Additionally, they warned that a change in methodology in 2021, or a random sample used, also affected the count that year, and that those figures should not be compared to those of other years.
Here’s how homeless numbers have changed over the years:
■ 2015: 7,509
■ 2016: 6,208
■ 2017: 6,490
■ 2018: 6,083
■ 2019: 5,530
■ 2020: 5,283
■ 2021: 5,083
■ 2022: 5,645
■ 2023: 6,566
Here’s how this year’s count breaks down by other demographic factors.
16,251
The total number of people projected to experience homelessness at some point in 2023. That’s also a 16 percent spike compared to 2022.
1,887
The number of unhoused people counted who suffer from mental health issues. In the same token, although not “mutually exclusive,” 1,614 were found to suffer from addiction. A total of 637 were victims of domestic violence.
87 percent
The number of single adults who were found to be unhoused. In 2022, that number was about 71 percent.
8 percent
The number of children who were homeless, up from 6 percent in 2022, with 331 of them unaccompanied by an adult.
Contact Ricardo Torres-Cortez at rtorres@reviewjournal.com Follow on X @rickytwrites.