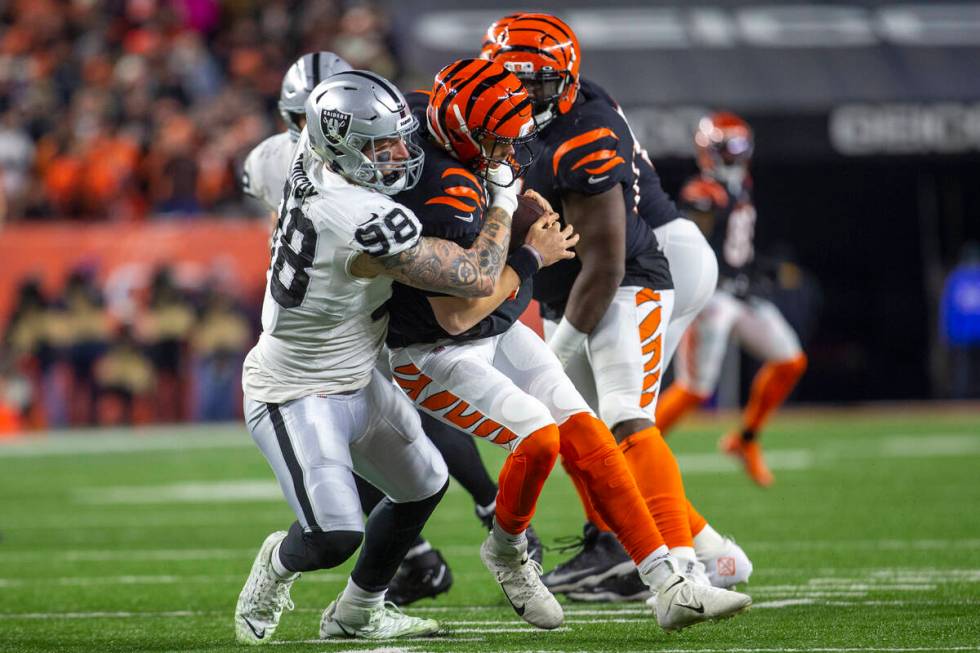
Advanced stats give more nuanced look at Raiders season

Statistics are a powerful tool that can measure just about anything that happens on a football field. They can also lie.
It’s why the development and increased acceptance of advanced stats and analytics have started to gain such traction.
Traditional statistics will tell you Maxx Crosby had a decent season. He finished with eight sacks and was clearly a factor on the Raiders’ defensive line. Thirty players in the NFL had more sacks than Crosby this season.
That’s why it makes so much sense to dig deeper. Crosby finished 10th in the league among edge defenders in pass-rush win rate and third in run-stop win rate.
The third-year pro led the league by a wide margin in quarterback pressures, depending on the tracking service.
Those numbers paint a much clearer picture of the kind of season a player had, as opposed to a total sack number that has so many additional variables.
Similar analytic deep dives can be done on just about any traditional individual stat.
They can also be a better way to compare one team against another beyond a simple won-loss record.
Can a 7-10 team be better than a 12-5 team? What if the sub-.500 team played the toughest schedule in the league while the 12-5 squad drew the easiest slate of opponents?
Statistics and analytics can reveal more about the relative strength of a team.
The Raiders finished 10-7 and made the postseason this year, but were they really that much better than last year’s 8-8 group that went home without a playoff berth?
Maybe not.
The 2020 version finished as the 19th-best team in the league, according to FootballOutsiders.com in total DVOA, which examines the performance of each team relative to the rest of the league and adjusted for schedule.
They were 21st in that metric this year.
It’s not the only measure that seems to suggest this season may not have been as impressive as the record may look at first glance.
The Raiders were outscored by their opponents by a total of 65 points this season, among the worst point differentials of any playoff team in history.
Before this season, only 46 of the 564 teams to qualify for the postseason since the 1970 merger had done so with a negative number in that column. Only 10 of those 46 did it when being outscored on average by more than three points per game like the Raiders did this season.
It doesn’t get much better when their historic success in close games is put under the microscope, either.
The Raiders went 5-0 in overtime and 7-2 in one-score games, a trend that is historically unsustainable.
According to ESPN Stats and Info, teams that were five games over .500 or better in close games went from 220-50 in that season to 102-126 the next in that category. Those teams on average declined by four wins per team in the second season.
It’s always important to look beyond the surface statistics.
Contact Adam Hill at ahill@reviewjournal.com. Follow @AdamHillLVRJ on Twitter.