The worst places to buy a home — and where to buy instead
Buyers looking to invest in a new home may be tempted to look to the biggest, best-known cities in the United States for their many attractions and amenities. However, these major cities can actually prove to be some of the worst places to buy a home due to their high populations, sky-high real estate prices, greater amounts of crime and sluggish home value growth.
Instead, future homebuyers or property owners might want to consider more affordable cities where home values are climbing so that they can reap a substantial return on their investment.
For this study, GOBankingRates analyzed the most expensive metro areas in the U.S. in terms of home price per square foot. The study then evaluated more affordable cities within each metro area by looking at the one- and five-year changes in median home value, percentage of homes with negative equity and violent and property crime rates to help prospective homebuyers identify some fantastic places to invest in.
Don’t Buy a Home in Boston
— 1-year home value change: 2.5%
—5-year home value change: 43%
Boston may boast great attractions like Fenway Park and Boston Harbor, but it’s probably not the best place to buy your starter home. Its real estate runs at a pretty high price per square foot, $724.90, for a relatively low return. Property crime isn’t great either at 22.54 offenses per 1,000 residents.
Instead, Choose Brockton
—1-year home value change: 6.8%
—5-year home value change: 59.6%
While violent and property crime rates are still a little higher in Brockton than one would prefer, the city offers proximity to all that Boston has to offer in a little more than an hour’s drive, with a much more pocket-friendly rate of $223.75 per square foot and a 6.8% one-year home value change.
Don’t Buy a Home in Denver
—1-year home value change: 2.0%
—5-year home value change: 59.1%
While the median home value in Denver was a comfortable $422,700 as of June 2019, and its five-year home value change was an impressive 59.1%, home values only rose by 2% in the past year.
Instead, Choose Aurora
— 1-year home value change: 3.7%
— 5-year home value change: 72.5%
The suburb of Aurora, a mere half-hour away from Denver, not only makes it easy to hit the city whenever you want, has quite a variety of attractions all its own but offers a better return on the value of a home. Its median home price is slightly lower than Denver’s, at $328,000, and its one- and five-year home value changes are both higher at 3.7% and 72.5%, respectively.
Don’t Buy a Home in Los Angeles
— 1-year home value change: 2.0%
— 5-year home value change: 39.9%
It might seem like Los Angeles has more freeways than homes, but more than 3.9 million live here, and they don’t do it for cheap. The average home in L.A. costs a whopping $688,700, or about $535 per square foot, with a five-year home value change of 39.9%.
Instead, Choose Compton
— 1-year home value change: 5.5%
— 5-year home value change: 57.7%
Compton, known as the “Hub City” because it’s almost perfectly in the middle of Los Angeles County, has a tidier population of almost 98,000. While crime is still understandably a concern in this city — its 11.97 violent crime incidents per 1,000 residents was the highest of all the cities in the L.A. metro area — purchasing a home is more in reach at $349.36 per square foot. And, the five-year home value change of 57.7%, the second-highest value change in the metro area, is significantly better as well.
Don’t Buy a Home in Miami
— 1-year home value change: 1.5%
— 5-year home value change: 44.3%
Miami may wow with its beaches and sunsets, but when it comes to the cost and value of homes, it’s not the leader. The median home price in Miami is $335,100, and its five-year home value change tops out at 44.3%. Ten percent of all mortgages are underwater here, too.
Instead, Choose North Miami
— 1-year home value change: 7.0%
— 5-year home value change: 130.6%
North Miami boasts proximity to all that Miami has to offer with a better real estate profile. The median home value is lower at $235,200, and the five-year change in the average home value was an astonishing 130.6%. Only 7% of mortgages are underwater here.
Don’t Buy a Home in Minneapolis
— 1-year home value change: 3.5%
— 5-year home value change: 38.7%
For the benefits of living in a bigger city, you’re typically going to pay a little more, see less growth on your real estate investment and deal with more crime. The cost per square foot of a home in Minneapolis is $265.65, with a five-year home value change of only 38.7%. The property crime rate is a steep 47.66 incidents per 1,000.
Instead, Choose Coon Rapids, Minnesota
— 1-year home value change: 6.2%
— 5-year home value change: 43.7%
This northern suburb of Minneapolis is only 12 miles away and situated along the gorgeous Mississippi River. Here, you pay less for your real estate at only $211.86 per square foot, with greater one- and five-year home value changes of 6.2% and 43.7%, respectively.
Don’t Buy a Home in New York
— 1-year home value change: 0.7%
— 5-year home value change: 33.4%
The Big Apple is an amazing place to visit but a costly place to live. Home to over 8.5 million people in its bustling city streets, housing runs an average of $704.89 per square foot. In addition, those hoping to see their property value increase quickly will be disappointed: its one-year home value change wasn’t even a full percentage point at just 0.7%.
Instead, Choose Mount Vernon, New York
— 1-year home value change: 17.1%
— 5-year home value change: 37.5%
Sitting north of the Bronx is the city of Mount Vernon, New York, home to about 68,000 people and a place of thriving real estate growth. Buyers can snag real estate for just $164.11 per square foot and see immediate growth with an impressive one-year value change of 17.1%.
Don’t Buy a Home in Portland, Oregon
— 1-year home value change: -1.9%
— 5-year home value change: 45.2%
Portland, Oregon, with a population of over 630,000 is not the place to buy a home for those looking for a quick return on their investment. Home values actually decreased by 1.9% over the past year. You may recoup some value over time, but city living also comes with a high property crime rate of 58.27 incidents per 1,000 residents.
Instead, Choose Vancouver, Washington
— 1-year home value change: 4.8%
— 5-year home value change: 60.5%
Less than a half-hour from Portland, just over the state line in Washington, sits lovely Vancouver. With a fraction of Portland’s population — 171,000 people call Vancouver home — it’s a city that appears to be on the rise. One-year home values rose by a respectable rate of 4.8%, and the property crime rate is significantly lower here than in Portland, at 31.15 incidents per 1,000 residents.
Don’t Buy a Home in Providence, Rhode Island
— 1-year home value change: 5.3%
— 5-year home value change: 57.9%
Providence actually saw higher increases in home values than many of the other major cities in this study, but over 9% of mortgages are underwater here, and the property crime was easily the highest in the metro area at 33.53 incidents per 1,000 residents.
Instead, Choose Woonsocket, Rhode Island
— 1-year home value change: 7.7%
— 5-year home value change: 62.2%
The southern New England community of Woonsocket is a better alternative to Providence for homebuyers who want to see the value of their homes improve a bit more quickly; home values increased by 62.2% over five years. Plus, a smaller percentage of mortgages — 8.2% — are underwater here.
Don’t Buy a Home in Riverside, California
— 1-year home value change: 3.4%
— 5-year home value change: 40.4%
To live in a big city like Riverside means to fork out extra money for the same kind of real estate you might find more cheaply in a neighboring city. Here, residents pay $246.61 per square foot, on average, but only saw a 3.4% increase in their home value over the past year.
Instead, Choose San Jacinto, California
— 1-year home value change: 5.7%
— 5-year home value change: 49.4%
San Jacinto, a neighboring community known for its hot springs, offers greater affordability and better value over time. Here, you’ll pay $157.09 per square foot, on average. Residents saw a one-year home value change of 5.7%.
Don’t Buy a Home in Salt Lake City
— 1-year home value change: 7.5%
— 5-year home value change: 67.3%
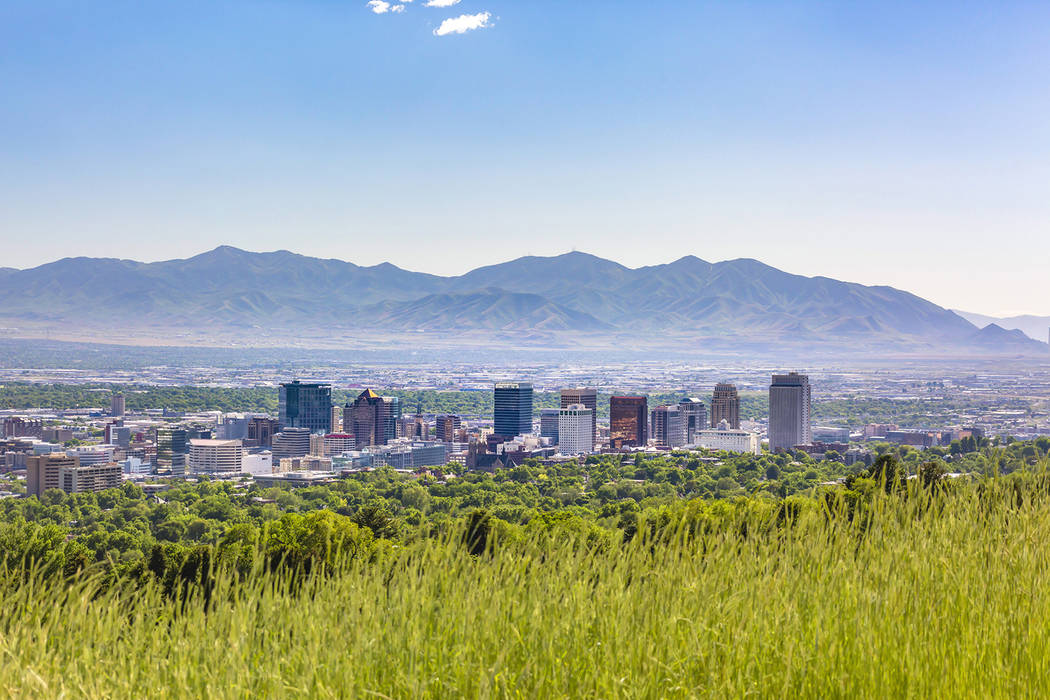
There’s a lot of natural beauty to admire in Salt Lake City, which might offset the slightly higher cost of real estate for some. Homes run for about $333.66 per square foot here, and the median home value is $394,900. But crime rates are higher in the city, and neighboring communities offer just as many amenities at lower prices.
Instead, Choose Murray City, Utah
— 1-year home value change: 9.1%
— 5-year home value change: 57.2%
Located south of Salt Lake City in equally beautiful surroundings is Murray City, a designated “Tree City” since the 1970s for its large number of trees. With a population that is less than 1/3 of Salt Lake City, you can purchase a home here for $208.75 per square foot, and the median home price holds strong at $352,700. It’s also worth noting that 0% of mortgages are underwater in this city.
Don’t Buy a Home in San Diego
— 1-year home value change: 1.8%
— 5-year home value change: 33.1%
The populous city of San Diego may be home to over 1.3 million people, but home values grow slower than some of the smaller, neighboring cities. San Diego only saw home values increase at a rate of 1.8% over the past year.
Instead, Choose National City
— 1-year home value change: 4.5%
— 5-year home value change: 49.1%
National City offers a smaller footprint for a better value. The median home value is an impressive $435,500, which is almost $200,000 cheaper than San Diego.
Don’t Buy a Home in San Francisco
— 1-year home value change: 2.5%
— 5-year home value change: 45.5%
San Francisco draws many people to it with its coastal views and bustling neighborhoods. It’s an undeniably beautiful city to live in, but there are downsides of living in a desirable place. One is the cost: in San Francisco, the home price per square foot stands at a whopping $1,078. And the property crime rate is high, at 62.48 incidents per 1,000 residents.
Instead, Choose San Rafael
— 1-year home value change: 5.1%
— 5-year home value change: 33.2%
Just across the Golden Gate Bridge from San Francisco is the town of San Rafael, the oldest and most culturally diverse city in Marin County. Better yet, the real estate is more affordable — $583.68 per square foot, almost half of San Francisco’s — and the property crime rate is lower at 27.98 incidents per 1,000 residents.
Don’t Buy a Home in San Jose
— 1-year home value change: -7%
— 5-year home value change: 46.7%
Home values in this major tech hub fell somewhat dramatically in the past year. With that said, home prices are still high — the median home price exploded from $686,000 in 2014 to over $1 million in 2019 — so those wishing to buy here are going to have to fork out some serious cash. Price per square foot currently stands at $636.48.
Instead, Choose Morgan Hill, California
— 1-year home value change: -7.2%
— 5-year home value change: 27.5%
Buyers interested in San Jose should check out the up-and-coming town of Morgan Hill, which is less than a half hour’s drive away. In Morgan Hill, home values also fell over the past year, but everything here is a little more affordable. The median home value rose from $697,300 in 2014 to $889,200 in 2019, and the price per square foot is $456.31.
Don’t Buy a Home in Seattle
— 1-year home value change: -5%
— 5-year home value change: 59%
Seattle may boast incredible natural attractions but its real estate values are being outpaced by smaller nearby cities. It’s still quite pricey to buy a home here, too, at $525.87 per square foot, and to make matters worse, home values sank by 5% over the past year. The average five-year home value change was a more heartening 59%, but that’s not the best value in the area.
Instead, Choose Tacoma
— 1-year home value change: 8.4%
— 5-year home value change: 72.9%
The port city of Tacoma, situated on the Puget Sound, still has affordable real estate at $239.26 per square foot. And homeowners will see value in as little as a year. The one-year home value change was 8.4%, and the five-year home value change was a robust 72.9%.
Don’t Buy a Home in Washington D.C.
— 1-year home value change: -0.4%
— 5-year home value change: 27%
Buyers pay $546.96 per square foot in the nation’s capital, but those who bought a home last year didn’t see any value on their investment. Additionally, violent and property crime rates are significantly higher than surrounding cities at 10.05 incidents and 42.84 incidents per 1,000 residents, respectively.
Instead, Choose Leesburg, Virginia
— 1-year home value change: 3.3%
— 5-year home value change: 17.1%
The historic town of nearby Leesburg, Virginia, which benefits from the prosperous Washington, D.C., economy, has managed to remain affordable: the cost per square foot is $220.78. Within one year, homeowners can expect a modest increase in home value, with a 3.3% uptick in the past year. Property crime rates here are less than half of what they are in the nation’s capital as well, at 16.36 incidents per 1,000 residents.
Chris Jennings contributed to the reporting for this article.
Methodology: GOBankingRates evaluated the most expensive major metro areas in the U.S. in terms of home price per square foot, and then analyzed more affordable cities within each metro area along the following criteria: (1) median list price per square foot, sourced from Zillow’s June 2019 index; (2) one-year change in median home value from June 2018 to June 2019, (3) five-year change in median home value from June 2014 to June 2019, both sourced from Zillow’s June 2019 home value index; (4) the percentage of homes with negative equity (“underwater”), sourced from Zillow; (5) violent crime rate per 1,000 residents and (6) property crime rate per 1,000 residents, sourced from Neighborhood Scout. In the case of cities in the Salt Lake City metro area, Zillow did not have data on the percentage of homes with negative equity; instead, for this case, the percentage of homes delinquent on their mortgage payments was used. All data was compiled on July 29, 2019.
This article originally appeared on GOBankingRates.com: 15 Worst Places To Buy a Home — and Where To Invest Instead
More from GoBankingRates.com
Find Out What Your Home Is Really Worth — And Why It's More Than You Think
Mortgage Rates Are Dropping — but These 5 Cities Are in Danger of a Housing Crash


